Alarmering med Grafana
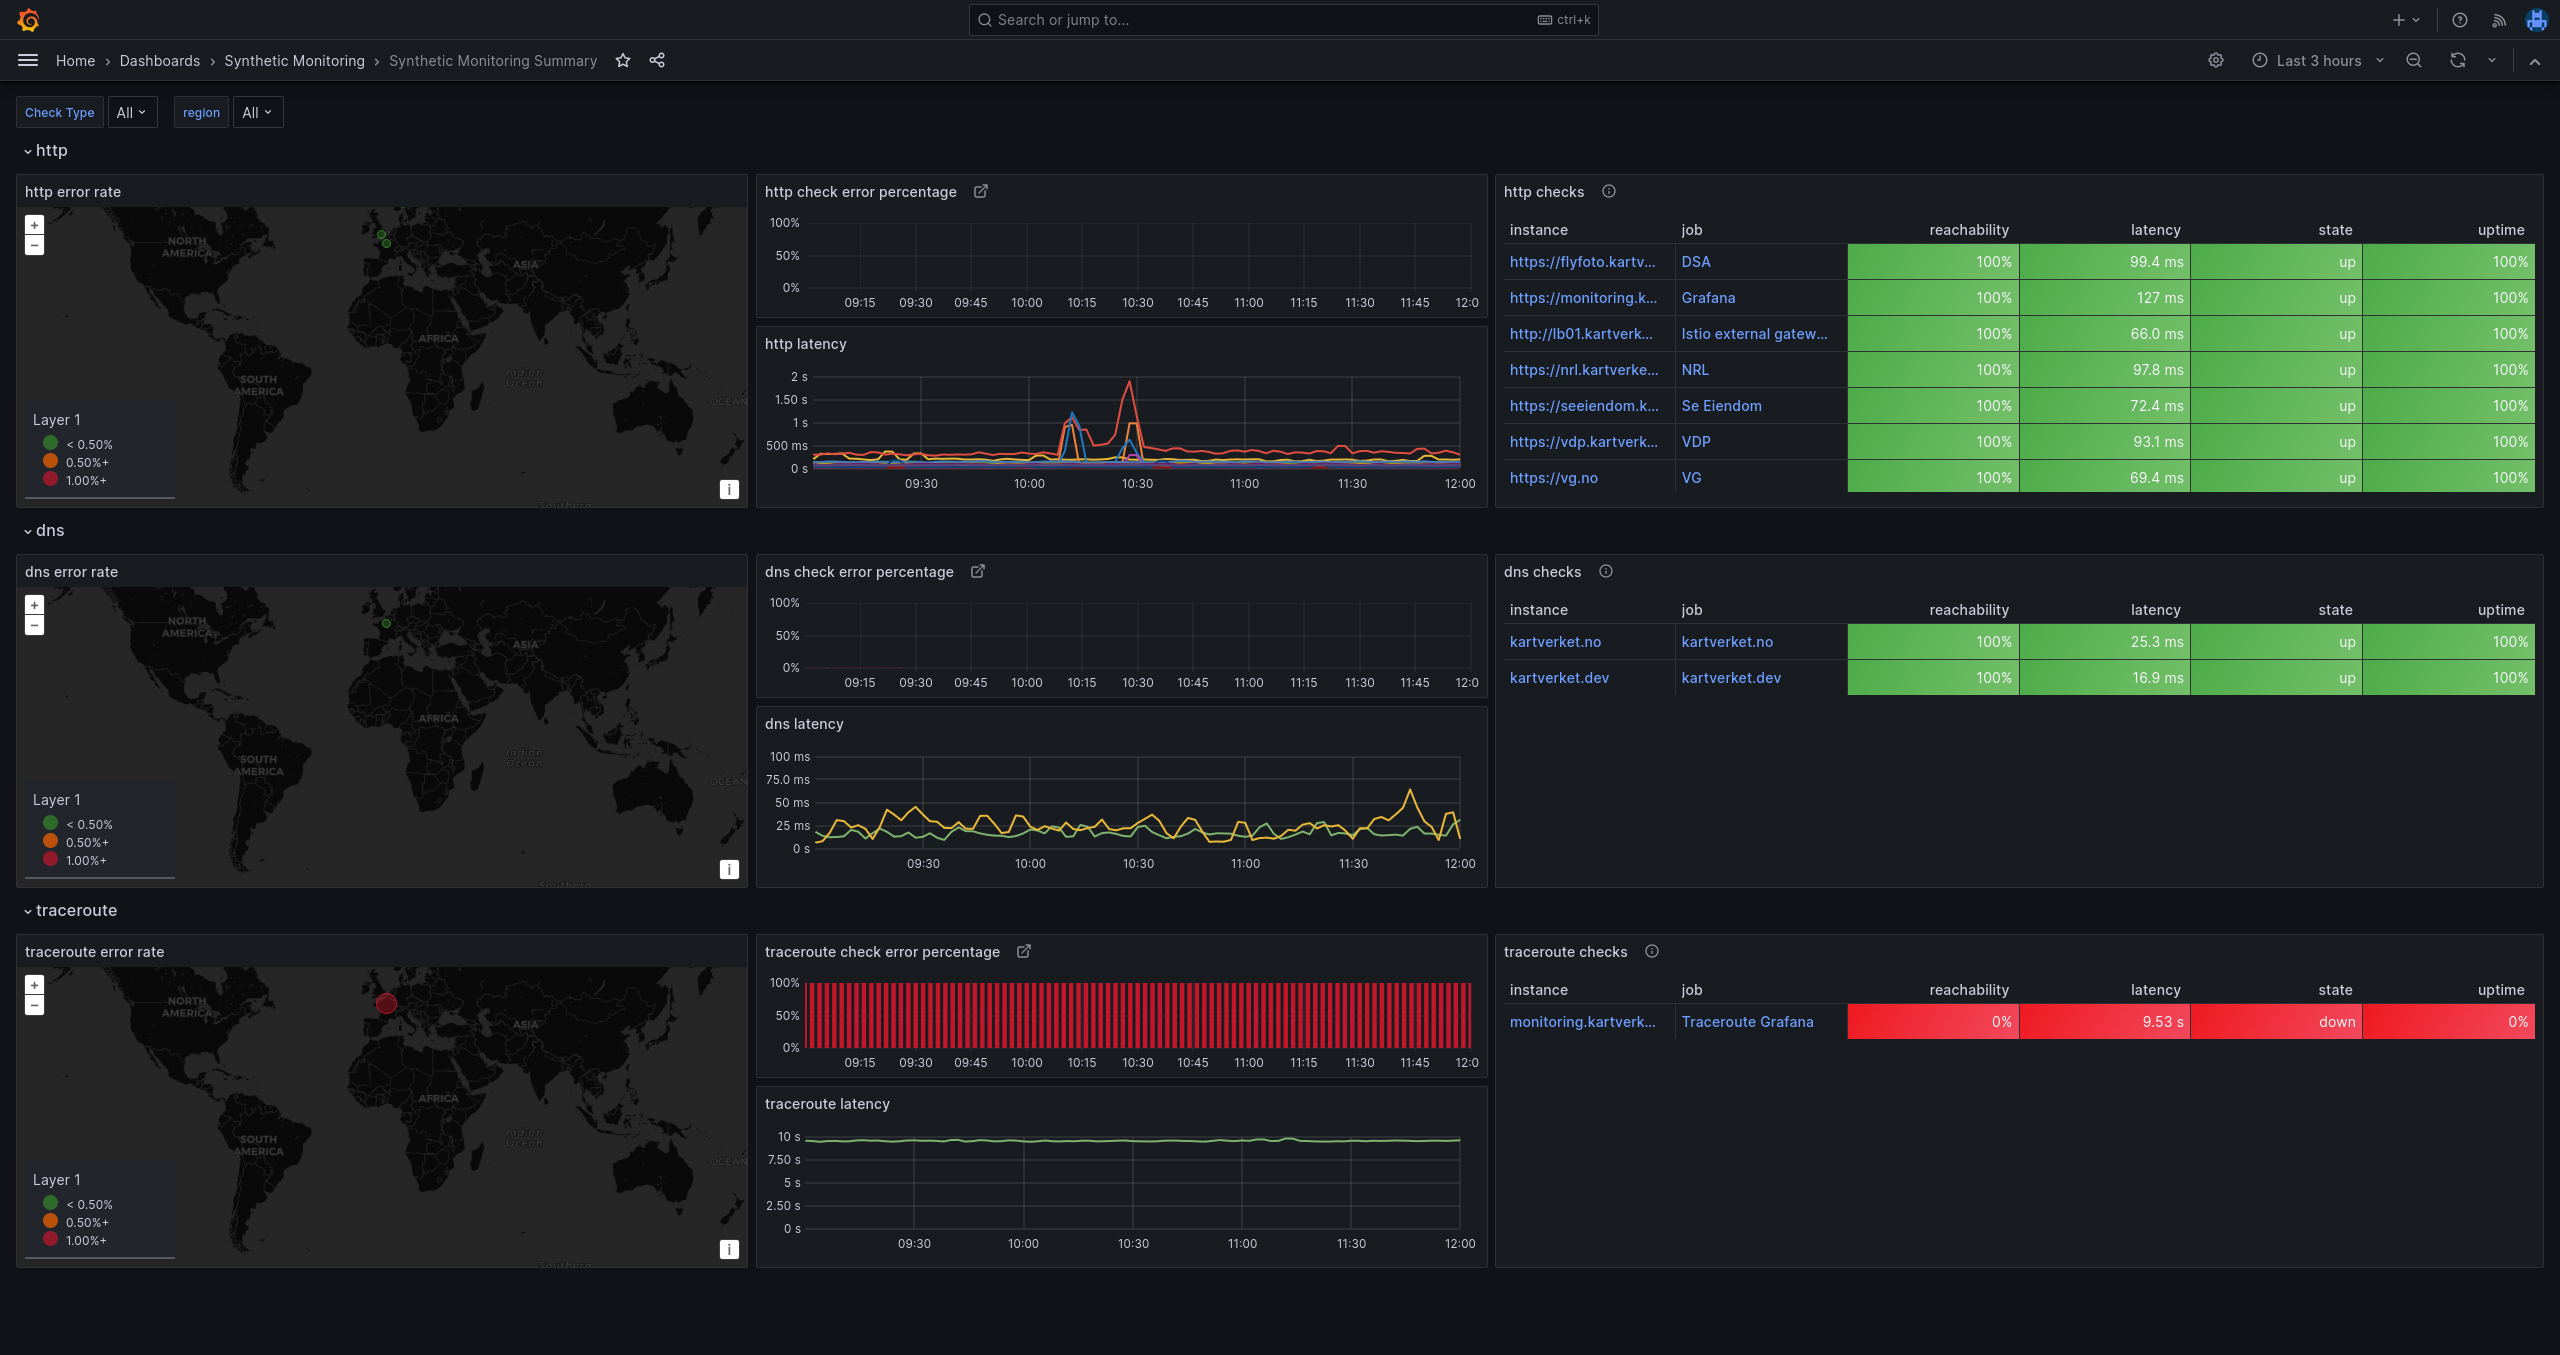
Applikasjoner på SKIP bruker Grafana for overvåking av uventede endringer i systemet. Når en alarm utløses, kan den enten håndteres som en kritisk alarm som sendes til flere kanaler, inkludert SMS og e-post, eller som en ikke-kritisk alarm som håndteres i kontortiden av produktteamet.
Her er noen nyttige lenker for håndtering av alarmer:
- Alarmkonfigurasjon (grafana-alerts på GitHub)
- Alarm-dashboard
- Dashboard for kritiske alarmer
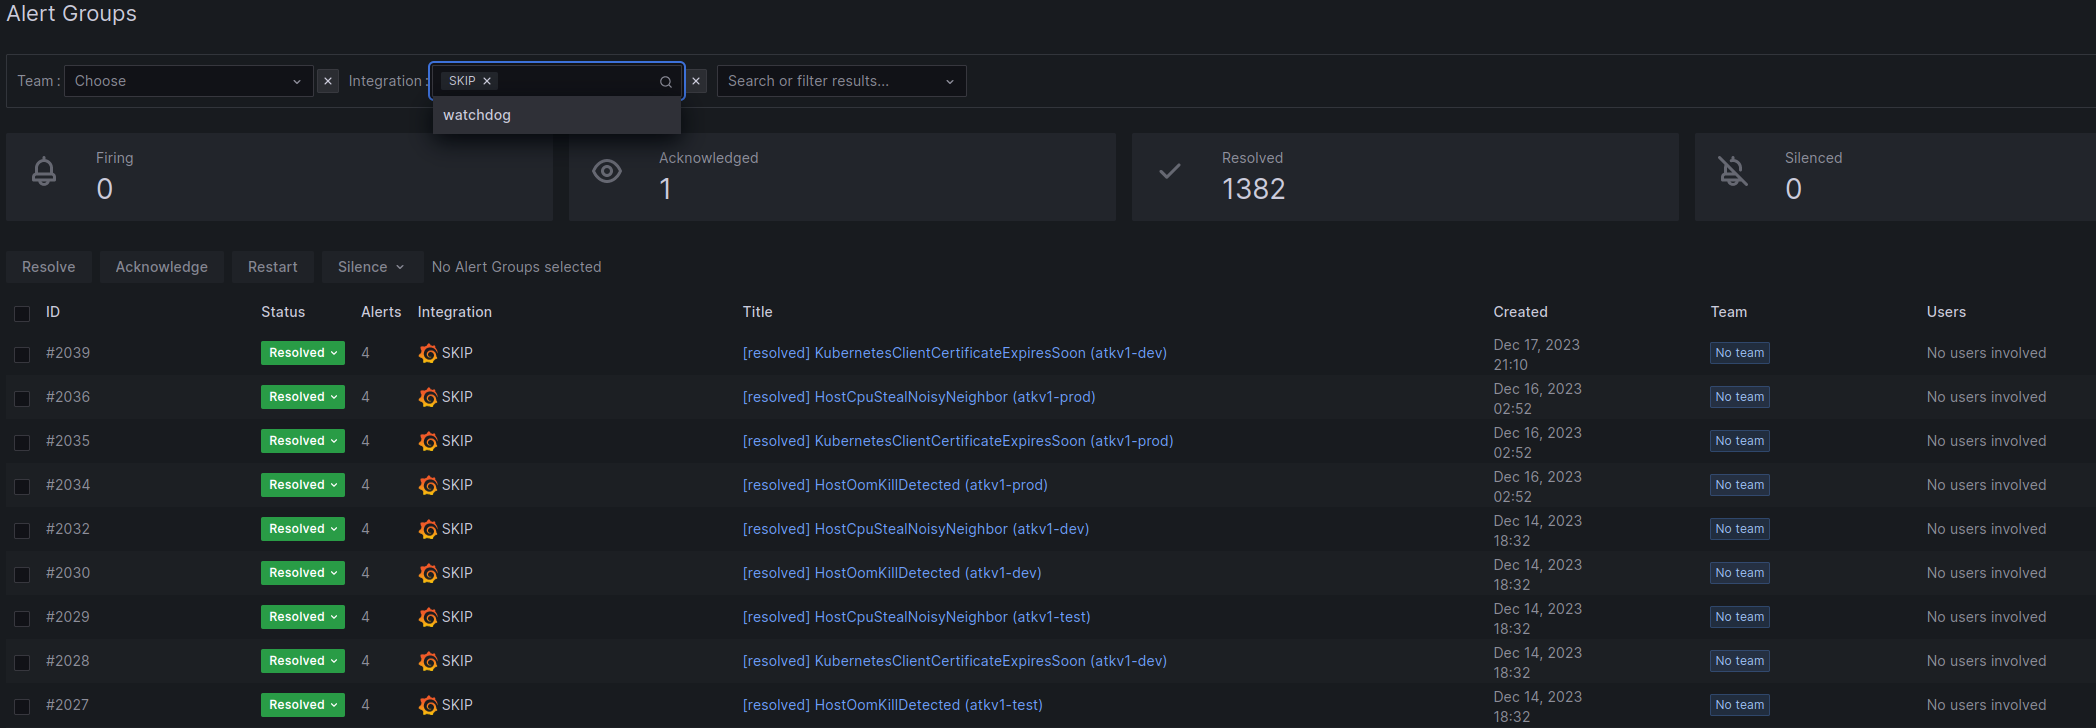
- Aktive hendelser
- Planlagte alarmpauser (vedlikeholdsperioder)
- Alarmtidsplaner
Opprette alarmer
Det første steget for å legge til alarmer for applikasjonen din er å onboarde appen til SKIP. Grafana brukes kun for applikasjoner på SKIP – resten av Kartverket bruker Zabbix. Når du er onboardet og har deployet appen din til SKIP, kan du be om tilgang til grafana-alerts-repoet.
grafana-alerts-repoet er designet for å inneholde alarmene til alle team og håndtere utrulling av alarmer til Grafana. Du vil få en fil som inneholder konfigurasjonen av alarmene dine i Terraform. For eksempel kan filen se slik ut:
resource "grafana_folder" "MYTEAMNAME_folder" {
  for_each = local.envs
  title    = "Alerts MYTEAMNAME ${each.key}"
}

module "MYTEAMNAME_alerts_kubernetes" {
  source   = "../modules/grafana_alert_group"
  for_each = local.envs

  name             = "kube-state-metrics"
  env              = each.value
  runbook_base_url = # URL to document describing each alert
  folder_uid       = grafana_folder.MYTEAMNAME_folder[each.key].uid
  team = {
    name = "MYTEAMNAME"
  }
  alerts = {
    KubernetesPodNotHealthy = {
      summary     = "Kubernetes Pod not healthy (instance {{ $labels.instance }})"
      description = "Pod has been in a non-ready state for longer than 15 minutes.\n  VALUE = {{ $value }}\n  LABELS = {{ $labels }}"
      severity    = "critical"
      for         = "15m"
      expr        = <<EOT
          sum by (namespace, pod) (kube_pod_status_phase{phase=~"Pending|Unknown|Failed", namespace=~"nrl-.*"})
      EOT
    },
    # ... more alerts
  }
}
I filen over oppretter vi en alarm som overvåker helsen til en pod i alle nrl-navnerom. Legg merke til expr-feltet, som bruker Prometheus sitt spørrespråk PromQL. Hvis du vil lære mer om PromQL, kan du se på dokumentasjonen samt noen eksempler fra Prometheus-dokumentasjonen og eksemplene på awesome prometheus alerts.
Dette er en fil du vil få CODEOWNERS-tilgang til. Det betyr at du og teamet ditt kan oppdatere filen og godkjenne egne endringer uten å involvere SKOOP. Teamet ditt forventes å holde alarmene på et nivå som verifiserer kjøretilstanden til applikasjonen.
Oppdatering av denne filen i GitHub-repoet vil automatisk rulle ut endringene til Grafana.
Grafana OnCall
I tillegg til Grafana-alarmer har vi installert Grafana OnCall-pluginen i Grafana. Denne pluginen gir oss muligheten til å legge til tidsplaner/vakter og tilpasse eskalering av alarmer. Den gir også teamet ditt en oversikt og et system for å håndtere alarmer.
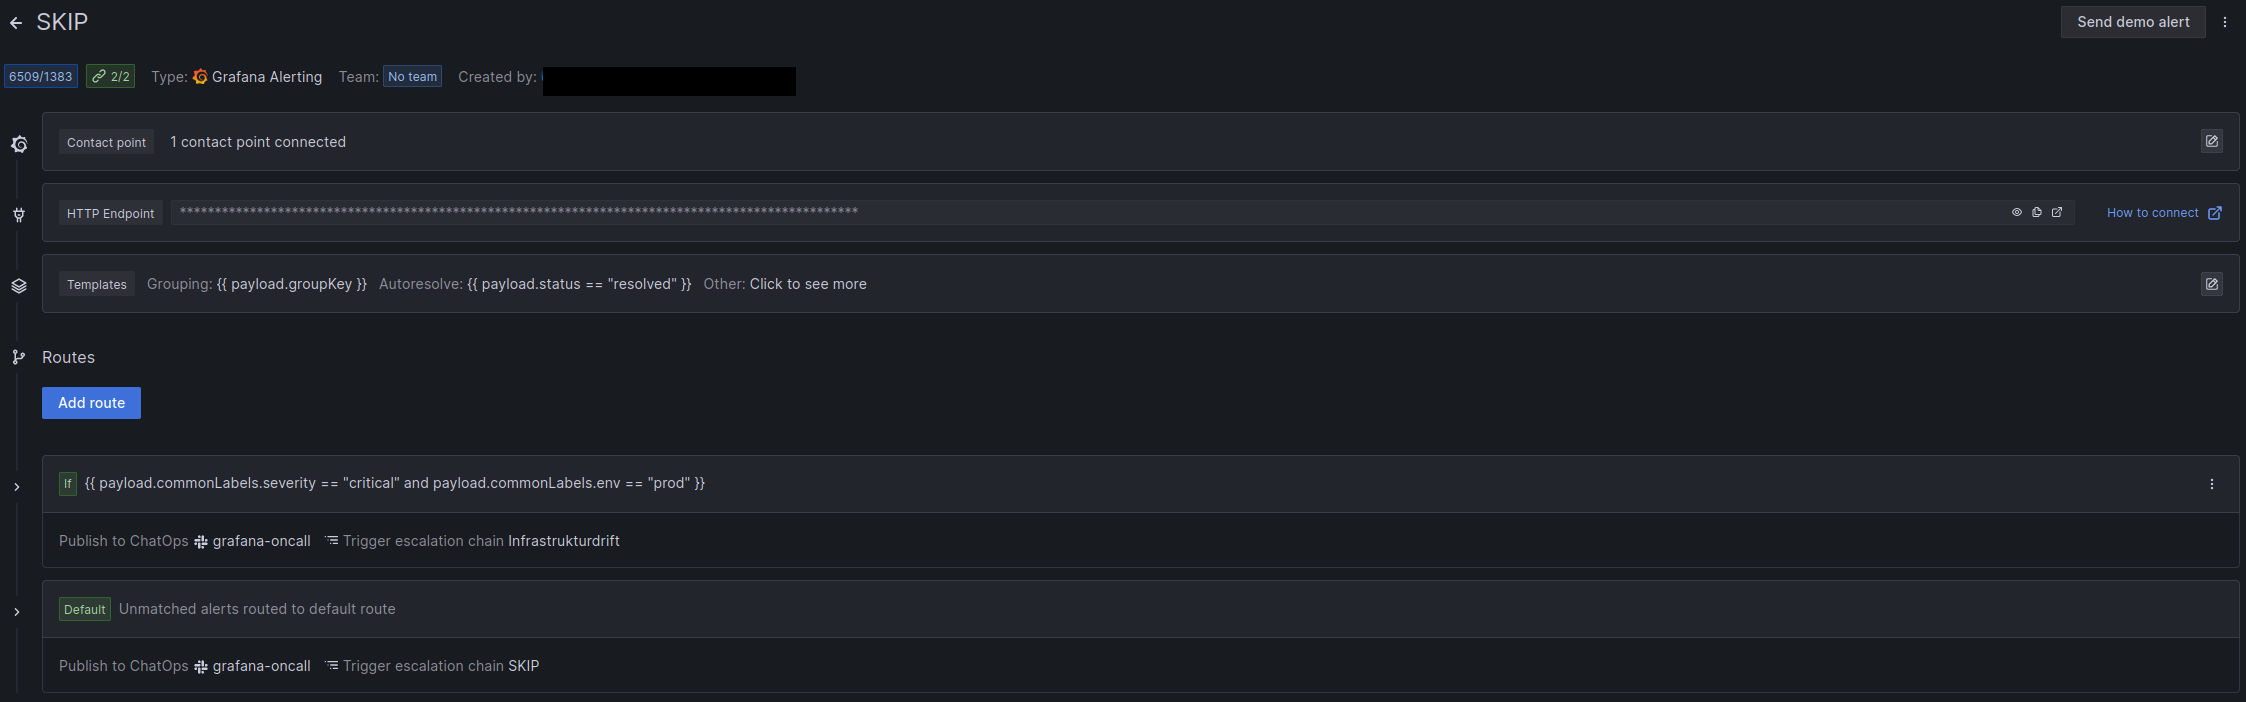
Integrasjon
For å begynne å bruke Grafana OnCall trenger du en OnCall-integrasjon mot Grafana. Denne integrasjonen vil dukke opp som et kontaktpunkt (contact point) i Grafana, som kan brukes i varslingsregler (notification policies) for å rute alarmer til integrasjonen din.
Fra integrasjonen kan du legge til ruter og eskaleringskjeder (routes and escalation chains) som bestemmer hvordan integrasjonen varsler teamet. Standardoppsettet er å sende alle alarmer til en Slack-kanal, og i tillegg til et teammedlem på vakt eller en delt innboks.
![]()
I grafana-alerts-repoet har vi laget en oncall_integration-modul som du kan bruke til å opprette integrasjonen for teamet ditt.
Ruter
I en integrasjon har du alltid en standardrute, men du kan også ha spesifiserte ruter. En rute bestemmer hvilken eskaleringskjede integrasjonen skal bruke når den mottar en alarm. For eksempel, hvis du har en kritisk app som krever 24/7-alarmering, kan du opprette en rute som sjekker bestemte labels, og hvis de finnes, ruter alarmen til «appdrift»-eskaleringskjeden.
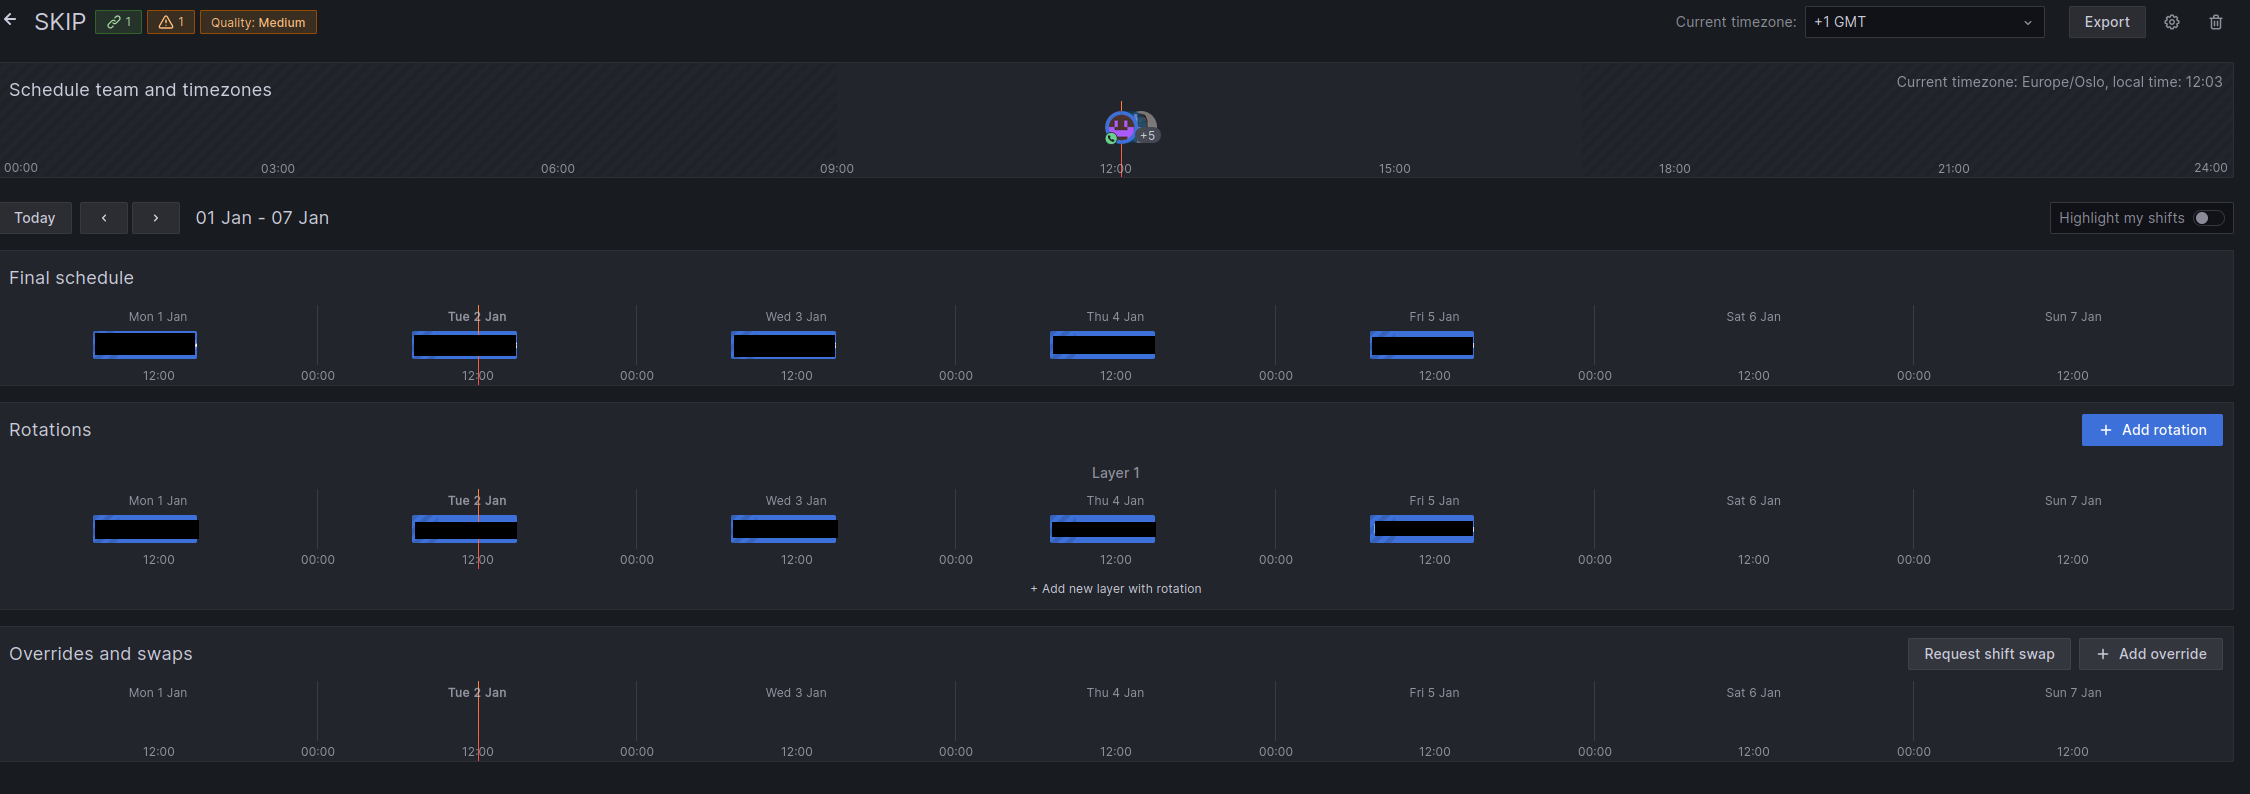
Tidsplaner
En OnCall-tidsplan er en samling av «vakter» (shifts). Kort fortalt betyr dette at du kan tildele en person til en vakt, og den personen vil motta alle alarmer sendt til OnCall-integrasjonen i løpet av vakten sin. I grafana-alerts-repoet kan du bruke oncall_team-modulen til å opprette både en tidsplan og en eskaleringskjede.
Eskaleringskjeder
Eskaleringskjeder (escalation chains) er instruksjoner til Grafana OnCall om hvordan du skal varsles når den tilkoblede integrasjonen mottar en alarm. Standardoppsettet her er å kontakte den tildelte personen på den angitte måten i OnCall.
Eskaleringskjeden nedenfor vil kontakte personen som har en tildelt vakt i tidsplanen, på den måten de har satt i OnCall. Vanligvis e-post eller Slack-omtaler.
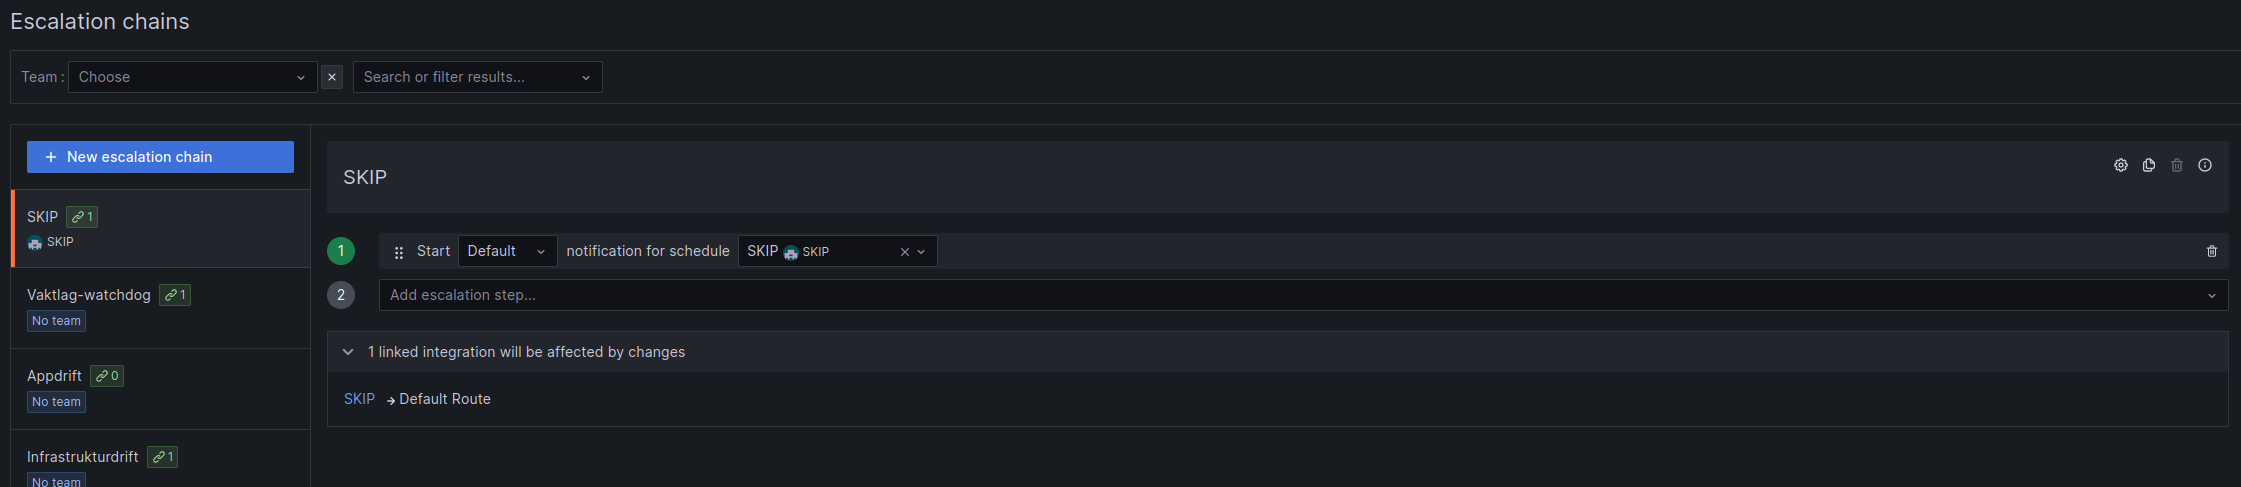
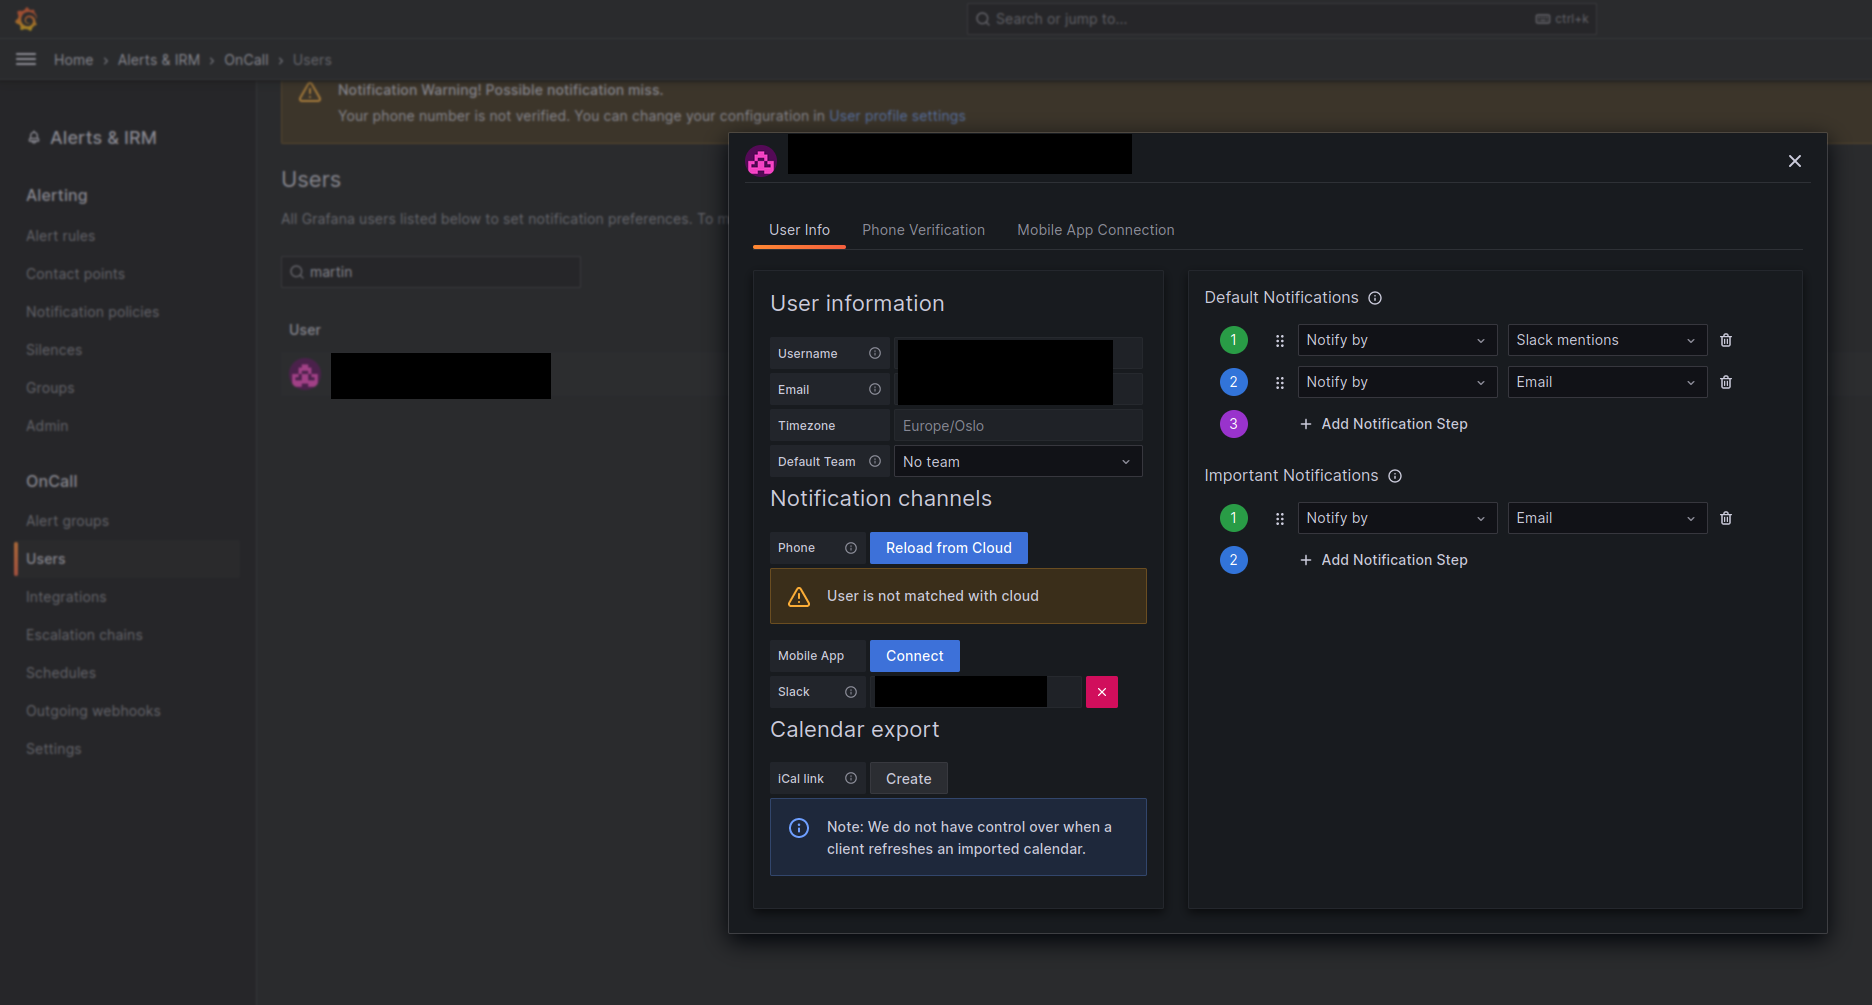
I OnCall → Users → rediger bruker kan du bestemme hvordan du vil at eskaleringskjeden skal kontakte deg.
Terraform
Et typisk Grafana OnCall-oppsett for et team ser slik ut:
module "team_oncall" {
    source                      = "../modules/oncall_team"
    team_name                   = "team"
    use_schedule                = true
}

module "team_integration" {
    source                      = "../modules/oncall_integration"
    integration_name            = "team"
    slack_channel_name          = "grafana-oncall" //Not required, replace with your own
    vaktlag_enabled             = false
    default_escalation_chain_id = module.team_oncall.team_escalation_chain_id
}
Slack-kanalen må allerede eksistere i Grafana.
Hvis du vil bruke forhåndsdefinerte brukere i stedet for en tidsplan, må brukerne allerede eksistere i OnCall.
Varslingsregler
Du må også konfigurere varslingsregler (notification policies) for å bruke integrasjonen din. Terraform aktiverer ikke kontaktpunktet for integrasjonen ennå, så dette må gjøres manuelt før du legger det til i Terraform (gjør dette ved å navigere til integrasjonen din og aktivere kontaktpunktet). Legg til kode her.
Eksempel:
policy {
  contact_point = "watchdog"
  group_by      = ["cluster", "alertname"]
  matcher {
    label = "team"
    match = "="
    value = "Vaktlag"
  }
}
24/7-alarmering
Når du har konfigurert et sett med alarmer, kan det hende du ønsker at de skal overvåkes 24/7. Kartverket tilbyr en løsning for dette i form av «Vaktlaget». Vaktlaget er et team bestående av ulike personer i IT-drift som har en spesialavtale som gjør at de kan varsles og følge opp når en alarm utløses utenfor normal arbeidstid.
Det første steget for å få alarmene dine onboardet til vaktlaget er å vedlikeholde et sett med alarmer som kun utløses ved alvorlige driftsforstyrrelser. Husk at en alarm som utløses potensielt kan vekke folk midt på natten, så det er avgjørende at dette settet med alarmer ikke inneholder ikke-kritiske eller ustabile alarmer. Disse alarmene bør gis alvorlighetsgrad «critical» for å skille dem fra andre alarmer.
Når du har gjort dette, må du kontakte vaktlaget for å diskutere alarmene du ønsker å onboarde. De vil vurdere hva som er viktig nok til å bli onboardet, og dere ender opp med et sett alarmer som er en god balanse mellom å sikre stabiliteten i systemene våre og å ivareta den mentale helsen til personene på vaktplanen.
Etter at du har diskutert med vaktlaget, kan du kontakte SKOOP i #gen-skoop for å få alarmintegrasjonen din koblet over. Når dette er gjort, vil alle alarmer merket med env=prod og severity=critical bli sendt til vaktlaget etter følgende tidsplan:
- Alarmene sendes til Slack-kanalen din hele dagen
- Alarmene sendes til appdrift som e-post, SMS og telefonsamtale mellom kl. 07 og 22
- Alarmene sendes til infrastrukturdrift som e-post, SMS og telefonsamtale mellom kl. 22 og 07
Du kan også opprette en pull request i grafana-alerts med vaktlag-eskaleringskjeden lagt til integrasjonen din:
module "skip" {
  source                      = "../modules/oncall_integration"
  integration_name            = "skip"
  slack_channel_name          = "grafana-oncall" //Not required, replace with your own
  vaktlag_enabled             = true
  vaktlag_escalation_chain_id = module.vaktlag.appdrift_escalation_chain_id
  default_escalation_chain_id = module.skip.team_escalation_chain_id
}
Når du senere legger til flere alarmer på kritisk nivå, må du også diskutere med vaktlaget slik at de kan godkjenne de nye alarmene før de legges til.