Reell brukerovervåking med Faro
Det kan ofte være vanskelig å oppdage lastetider for sider og brukeratferd i nettleseren, ettersom det ikke genereres logger eller metrikker å inspisere. Grafana Faro løser dette ved at du kan legge til en JavaScript-SDK i frontenden din som sender hendelser over HTTP til en mottaker som legger dataene inn i Grafana. På denne måten kan du observere reelle brukermetrikker i sanntid ved hjelp av Grafana, og sette opp varsler på dem slik du vanligvis ville gjort med Grafana Alerting.
Det er flere typer hendelser som støttes av Faro:
- Hendelser som Time To First Byte og First Contentful Paint kan hjelpe med feilsøking av trege frontend-sider
- Unntak (exceptions) samles inn og sendes, slik at du har en komplett oversikt over alle unntak som har blitt kastet i frontenden til appen din. Source maps brukes til å mappe linjenumre tilbake til kildekoden
- Sidebesøk telles slik at du kan se hvilke sider som besøkes av brukere
- Metadata som nettlesertype gjør det mulig å se hvilke nettlesere som er i bruk, og hvilke du ikke lenger trenger å støtte
Du har kanskje hørt om lignende tjenester som Sentry.io. Faro skal ikke forveksles med en analysetjeneste, og det anbefales å ha en egen instans for brukerinnsikt som Google Analytics eller PostHog. En analysetjeneste kan fortelle deg mer om brukeratferd, mens tjenester som Faro og Sentry er mer beregnet på overvåking og feilsøking.
Kom i gang
Oppsett av Faro krever to steg som er forklart nedenfor:
- Installere SDK-en
- Konfigurere SDK-en
Det kan også være nyttig å starte med å lese Faro hurtigstartguide. Se også README på Faros GitHub-side for flere lenker til relevant dokumentasjon.
Installere SDK-en
Hvis du bruker React gjøres dette ved å kjøre en av følgende kommandoer:
# Med npm
npm i -S @grafana/faro-web-sdk

# Med Yarn
yarn add @grafana/faro-web-sdk
Konfigurere SDK-en
Importer og konfigurer følgende alternativer i appens inngangspunkt (main.js eller lignende).
import { initializeFaro } from "@grafana/faro-react";

initializeFaro({
  app: {
    name: "my_app_name",
    environment: getCurrentEnvironment(),
  },
  url: "https://faro.atgcp1-prod.kartverket.cloud/collect",
});
Gyldige alternativer for app
| Type | Beskrivelse | Påkrevd? | |
|---|---|---|---|
| name | string | Navnet på applikasjonen slik det vil vises på dashbord i Grafana | Ja |
| environment | "localhost" | "dev" | "test" | "prod" | Miljøet frontenden kjører i. Dette brukes til å filtrere data i Grafana-dashbord | Ja |
Konfigurere SDK-en med React Router-integrasjon
Grafana Faro støtter integrasjon med React Router. Dette gir deg hendelser for sidenavigasjon og re-renderinger. Se Faro-dokumentasjonen for mer informasjon om dette.
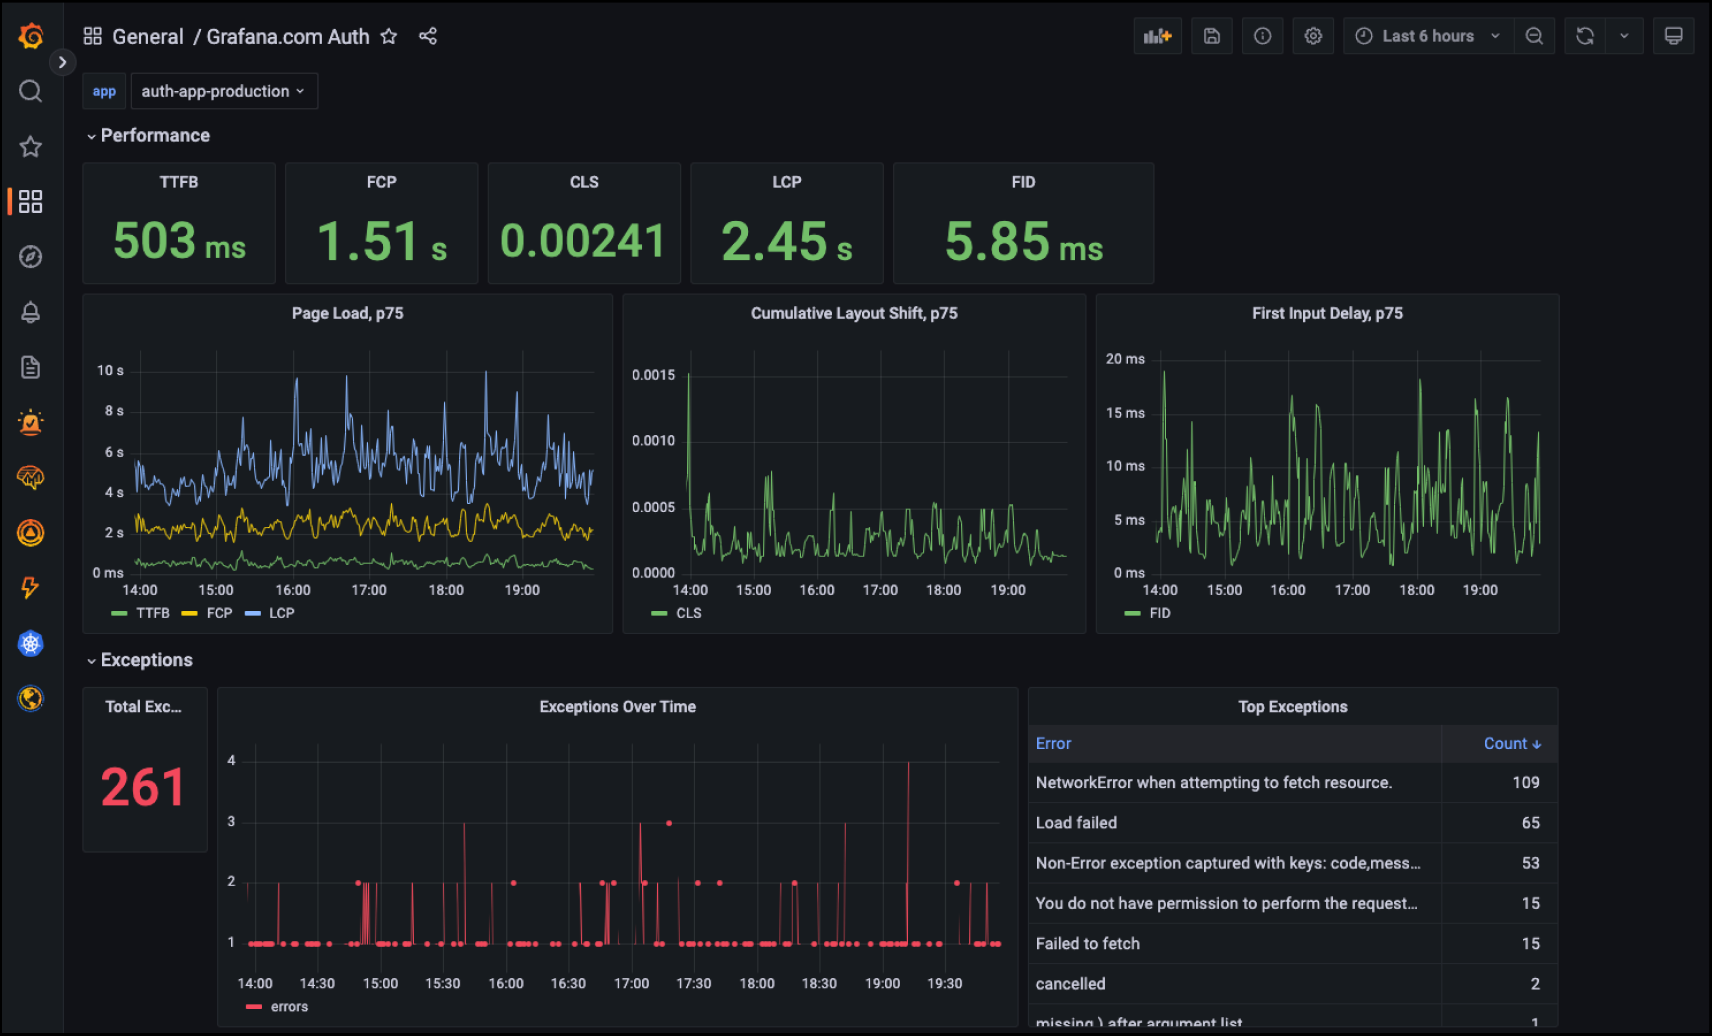
Vise dataene
Når metrikkene har begynt å bli samlet inn, vil de være synlige i et dedikert Grafana Faro-dashbord. Dette dashbordet finner du her.
Det er også mulig å søke etter data i utforsk-visningen. Nyttige etiketter å søke etter er:
faro_app_namekindenv
Personvern
Det er opp til deg og teamet ditt å vurdere hvordan Faro brukes med personopplysninger, i henhold til deres ROS-analyse og DPIA
Når vi sender data til Faro, er det stort sett metrikker som ikke inneholder personidentifiserbar informasjon (PII). Det er mulig å inkludere PII som navn, IP-adresse eller annet som er tilgjengelig fra JavaScript i SDK-en, men dette gjøres ikke som standard og krever at du kaller setUser-funksjonen i SDK-en.
En sesjons-ID sendes med for å muliggjøre de-duplisering av hendelser som navigasjon mellom sider og rangering av toppbrukere. Dette er en tilfeldig generert streng og lagres i brukerens nettleser-SessionStorage. Merk at selv om dette ikke er en informasjonskapsel (cookie), betyr det at et «cookie-banner» er påkrevd i henhold til EUs ePrivacy-direktiv.
Ettersom SessionInstrumentation er inkludert som standard i webinstrumenteringen av JavaScript-SDK-en, krever deaktivering at du kaller SDK-en med instrumentations satt og utelater SessionInstrumentation-funksjonen.
Data lagres på SKIPs atgcp1-prod-cluster, som lagrer data i Google Cloud Storage europe-north1-regionen. Denne regionen ligger i Finland, og er dermed innenfor EU. Dette betyr at ingen data forlater EUs grenser, noe som gjør lagringen av dataene i samsvar med GDPR.
Rate limiting
En hastighetsbegrensning for forespørsler er implementert og er for øyeblikket satt til 50 forespørsler per sekund. Denne deles mellom alle brukere av Faro, så det er mulig at vi etter hvert når grensen. Kontakt SKIP hvis du begynner å få forespørsler avvist med HTTP 429 Too Many Requests.
Algoritmen for hastighetsbegrensning er en token bucket-algoritme, der en bøtte har en maksimal kapasitet for opptil burst_size forespørsler og fylles på med en hastighet på rate per sekund.
Hver HTTP-forespørsel tapper kapasiteten til bøtten med én. Når bøtten er tom, avvises HTTP-forespørsler med statuskoden HTTP 429 Too Many Requests til bøtten har mer tilgjengelig kapasitet.
Tracing
Faro støtter sporing av HTTP-forespørsler, men dette er foreløpig ikke implementert i mottakeren på SKIP. Kontakt SKIP hvis du ønsker dette!