Distribuert tracing med Tempo
Hva er distribuert tracing?
I distribuerte systemer er det til enhver tid mange parallelle prosesser som kjører. Noen av disse henger sammen eller utløser hverandre. Distribuert tracing lar deg følge en forespørsel gjennom hele systemet – på tvers av tjenester og komponenter. Hver forespørsel får en unik Trace ID, og deloperasjoner registreres som spans. Dette gir deg innsikt i hvor tid brukes, hvor feil oppstår, og hvordan tjenestene samhandler.
Hvordan fungerer distribuert tracing på SKIP?
Som en del av LGTM-stacken (Loki, Grafana, Tempo, Mimir) brukes Grafana Tempo for distribuert tracing. Tempo er fullt integrert med resten av observerbarhetsstacken og deler brukergrensesnitt og autentisering med Grafana, Mimir og Loki.
Applikasjoner må selv sende traces til Tempo. Dette gjøres ved å instrumentere applikasjonen med OpenTelemetry og konfigurere den til å eksportere traces via OTLP til Tempo (via Grafana Alloy). Deretter kan du se og analysere traces i Grafana.
Kom i gang
Instrumentering
For å generere og sende traces må applikasjonen instrumenteres. OpenTelemetry er standarden for instrumentering og støttes av SKIP.
Det finnes to tilnærminger:
- Automatisk instrumentering (anbefalt): Krever minimale kodeendringer. For Java brukes OpenTelemetry Java-agenten. For andre språk, se OpenTelemetry zero-code instrumentation.
- Manuell instrumentering: Gir mer kontroll, men krever mer arbeid. Bruk OpenTelemetry SDK-ene for ditt programmeringsspråk. Vi anbefaler sterkt å starte med automatisk instrumentering.
Konfigurasjon
Applikasjoner sender traces via OTLP til den cluster-interne tjenesten otlp.grafana-alloy. Du kan bruke gRPC på port 4317 (anbefalt) eller HTTP på port 4318.
Legg til følgende miljøvariabler i Skiperator-manifestet:
env:
  - name: OTEL_EXPORTER_OTLP_ENDPOINT
    value: "http://otlp.grafana-alloy:4317"
  - name: OTEL_EXPORTER_OTLP_PROTOCOL
    value: "grpc"
  - name: OTEL_SERVICE_NAME
    value: "min-tjeneste"
Java-oppsett
For Java-applikasjoner brukes OpenTelemetry Java-agenten. Last ned agenten i et multi-stage Dockerfile-bygg og legg den til i det endelige imaget:
FROM eclipse-temurin:21-alpine AS otel
ARG OTEL_AGENT_VERSION=2.12.0
RUN wget -q -O /opentelemetry-javaagent.jar \
https://github.com/open-telemetry/opentelemetry-java-instrumentation/releases/download/v${OTEL_AGENT_VERSION}/opentelemetry-javaagent.jar
FROM eclipse-temurin:21-alpine
COPY /opentelemetry-javaagent.jar /agents/opentelemetry.jar
COPY target/app.jar /app.jar
USER 1000
ENTRYPOINT ["java", "-jar", "/app.jar"]
Aktiver agenten og konfigurer OpenTelemetry ved å sette JAVA_TOOL_OPTIONS i Skiperator-manifestet. Her er et komplett eksempel:
env:
  - name: JAVA_TOOL_OPTIONS
    value: >-
      -javaagent:/agents/opentelemetry.jar
      -Dotel.exporter.otlp.protocol=grpc
      -Dotel.exporter.otlp.traces.endpoint=http://otlp.grafana-alloy:4317
      -Dotel.resource.attributes=service.name=min-tjeneste
      -Dotel.propagators=tracecontext,baggage,b3,b3multi
      -Dotel.traces.exporter=otlp
      -Dotel.metrics.exporter=none
      -Dotel.logs.exporter=none
      -Dotel.traces.sampler=parentbased_traceidratio
      -Dotel.traces.sampler.arg=0.10
| Property | Beskrivelse |
|---|---|
otel.exporter.otlp.protocol | Protokoll for eksport. grpc er anbefalt. |
otel.exporter.otlp.traces.endpoint | Endepunkt for trace-eksport. |
otel.resource.attributes | Sett service.name til navnet på tjenesten din. |
otel.propagators | Kontekstpropageringsformater. Inkluderer b3/b3multi for bakoverkompatibilitet. |
otel.traces.exporter | Eksporter-type. Bruk otlp. |
otel.metrics.exporter / otel.logs.exporter | Satt til none da metrikker og logger håndteres separat. |
otel.traces.sampler | Samplingstrategi. parentbased_traceidratio gjør hodebasert sampling. |
otel.traces.sampler.arg | Samplingrate mellom 0.0 og 1.0. 0.10 betyr at 10% av traces samles inn. |
Når du bruker Java-agenten med JAVA_TOOL_OPTIONS trenger du ikke sette OTEL_EXPORTER_OTLP_ENDPOINT og OTEL_SERVICE_NAME som separate miljøvariabler — disse konfigureres via system properties i JAVA_TOOL_OPTIONS i stedet.
Se traces i Grafana
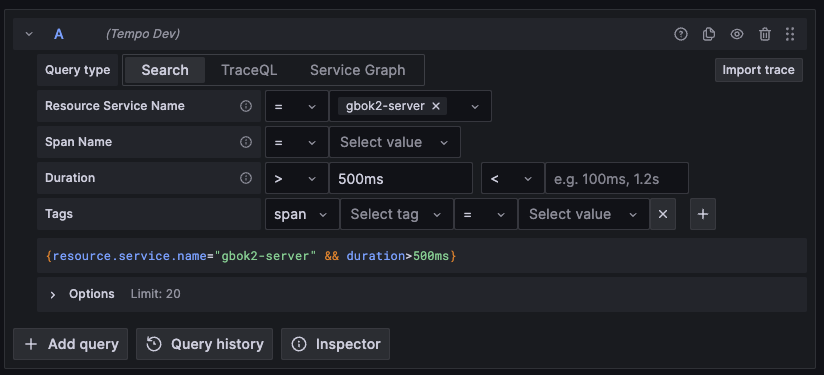
Traces kan ses i Grafana på monitoring.kartverket.cloud. Velg Explore i menyen og deretter riktig Tempo-datakilde for miljøet du vil se traces fra.
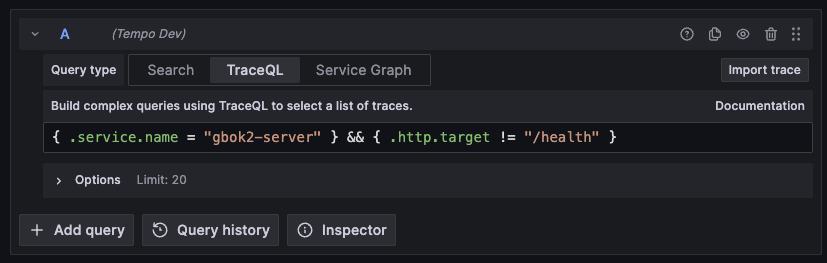
Du kan bruke enten Search-fanen (grafisk spørringsverktøy) eller TraceQL-fanen (manuell spørring):